Using the Plot Feature in NECTO Studio
The Plot feature in NECTO Studio provides a powerful way to visualize real-time sensor data, helping you analyze trends, debug your application, and compare multiple data points efficiently. This tutorial will guide you through a practical example of using the Plot feature to display temperature sensor readings.
Practical Example: Visualizing Temperature Data from Thermo 21 Click
📌 Reference Image: 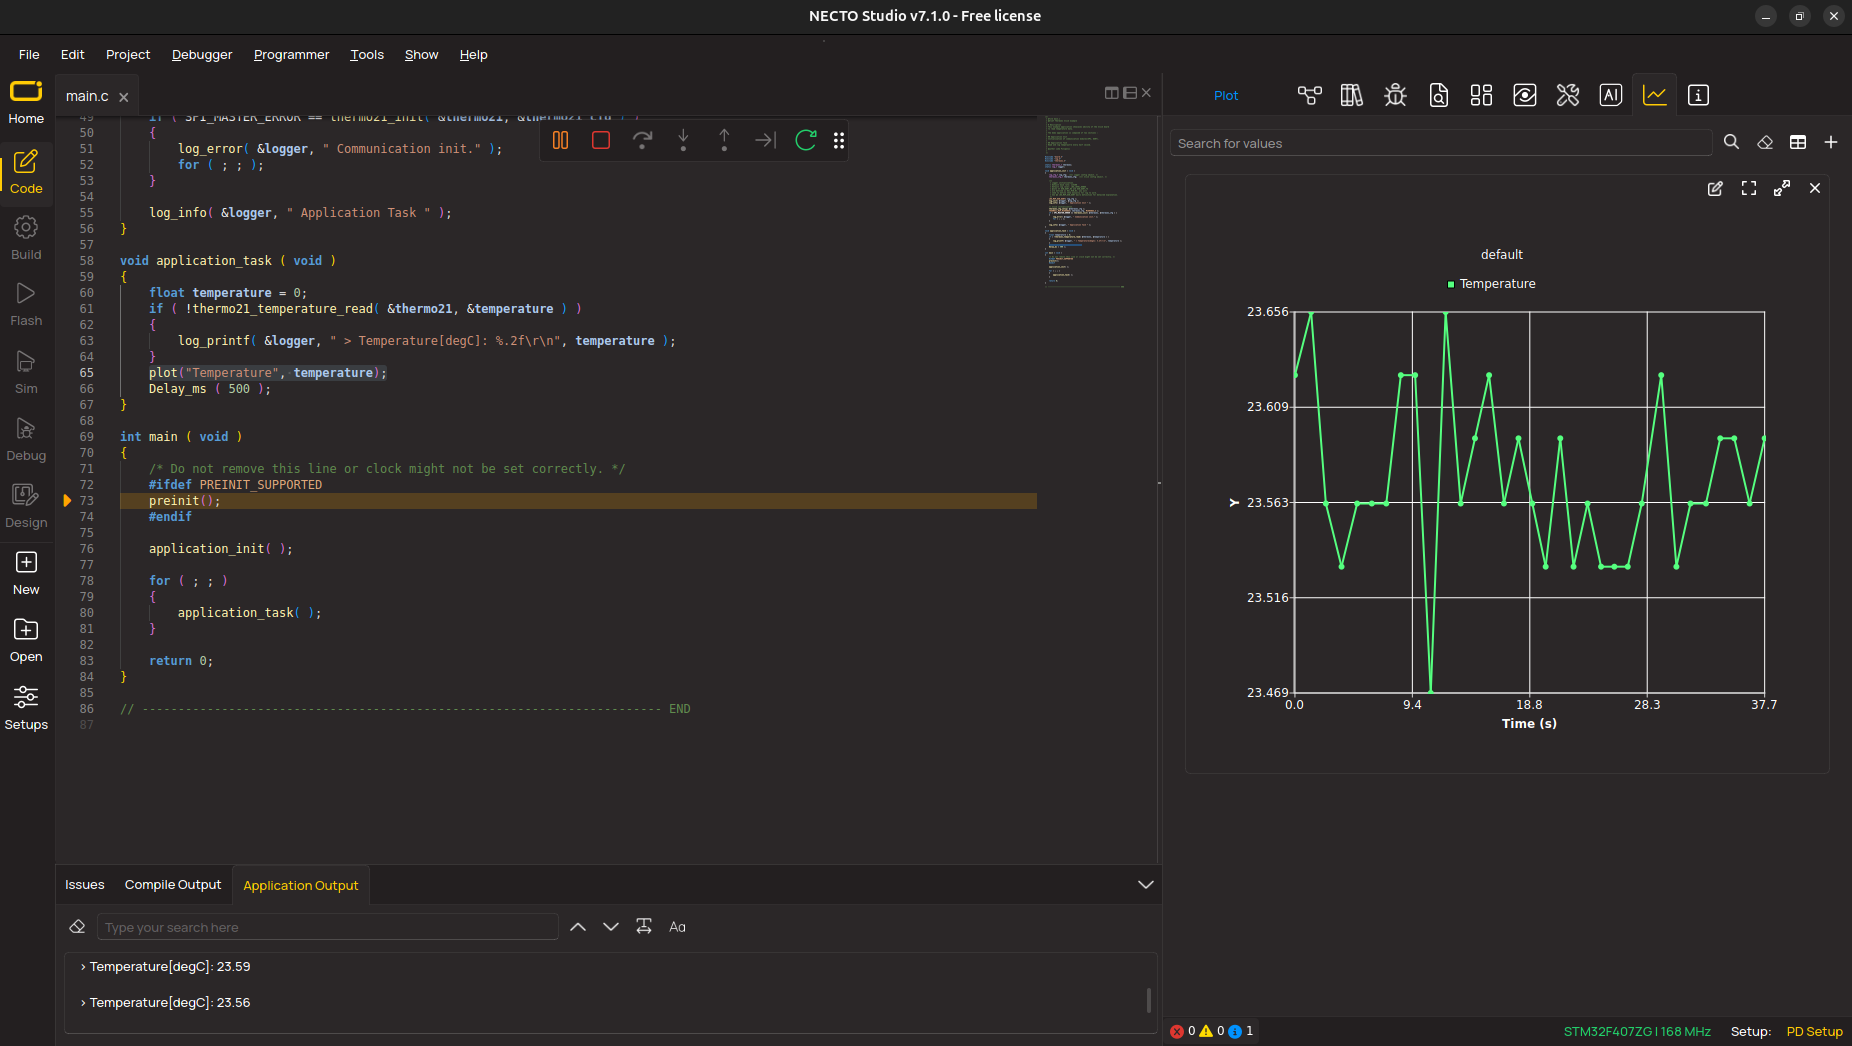
Step 1: Set Up Your Environment
- Run NECTO Studio.
- Navigate to the
Codesection on the left-hand side toolbar of the NECTO Studio interface. - Open the
Planet Debugtab (Right-hand side of the NECTO Studio Interface). - Shortcut: Press
CTRL+6on your keyboard.
Step 2: Connect to a Hardware Setup with a Sensor
- Select a hardware setup that includes a temperature sensor.
- Example:
Smart Thermostatsetup with aThermo 21 Clickboard. - Select
GOand connect to the hardware via Planet Debug, free of charge!
Step 3: Install and Configure the Sensor Package
- Open the Package Manager.
- Shortcut: Press
CTRL+5. - Search for the
Thermo 21 Clickpackage and install it. - Open the package and locate the
main.cfile (main.cis opened by default in the Code Editor). - Update the Click board's position:
- Replace
MIKROBUS_1withMIKROBUS_3(or the actual mikroBUS position where the Click board is placed).
Step 4: Insert the plot Function to Visualize Data
- Switch to the
Plottab on the right-hand side of the interface. - Shortcut: Press
CTRL+9. - Read the brief
Plotinstructions available in the tab. -
Modify the code to include the
plotfunction: -
Locate the
application_taskfunction insidemain.c. - Add the following line of code:
📌 Reference Image: 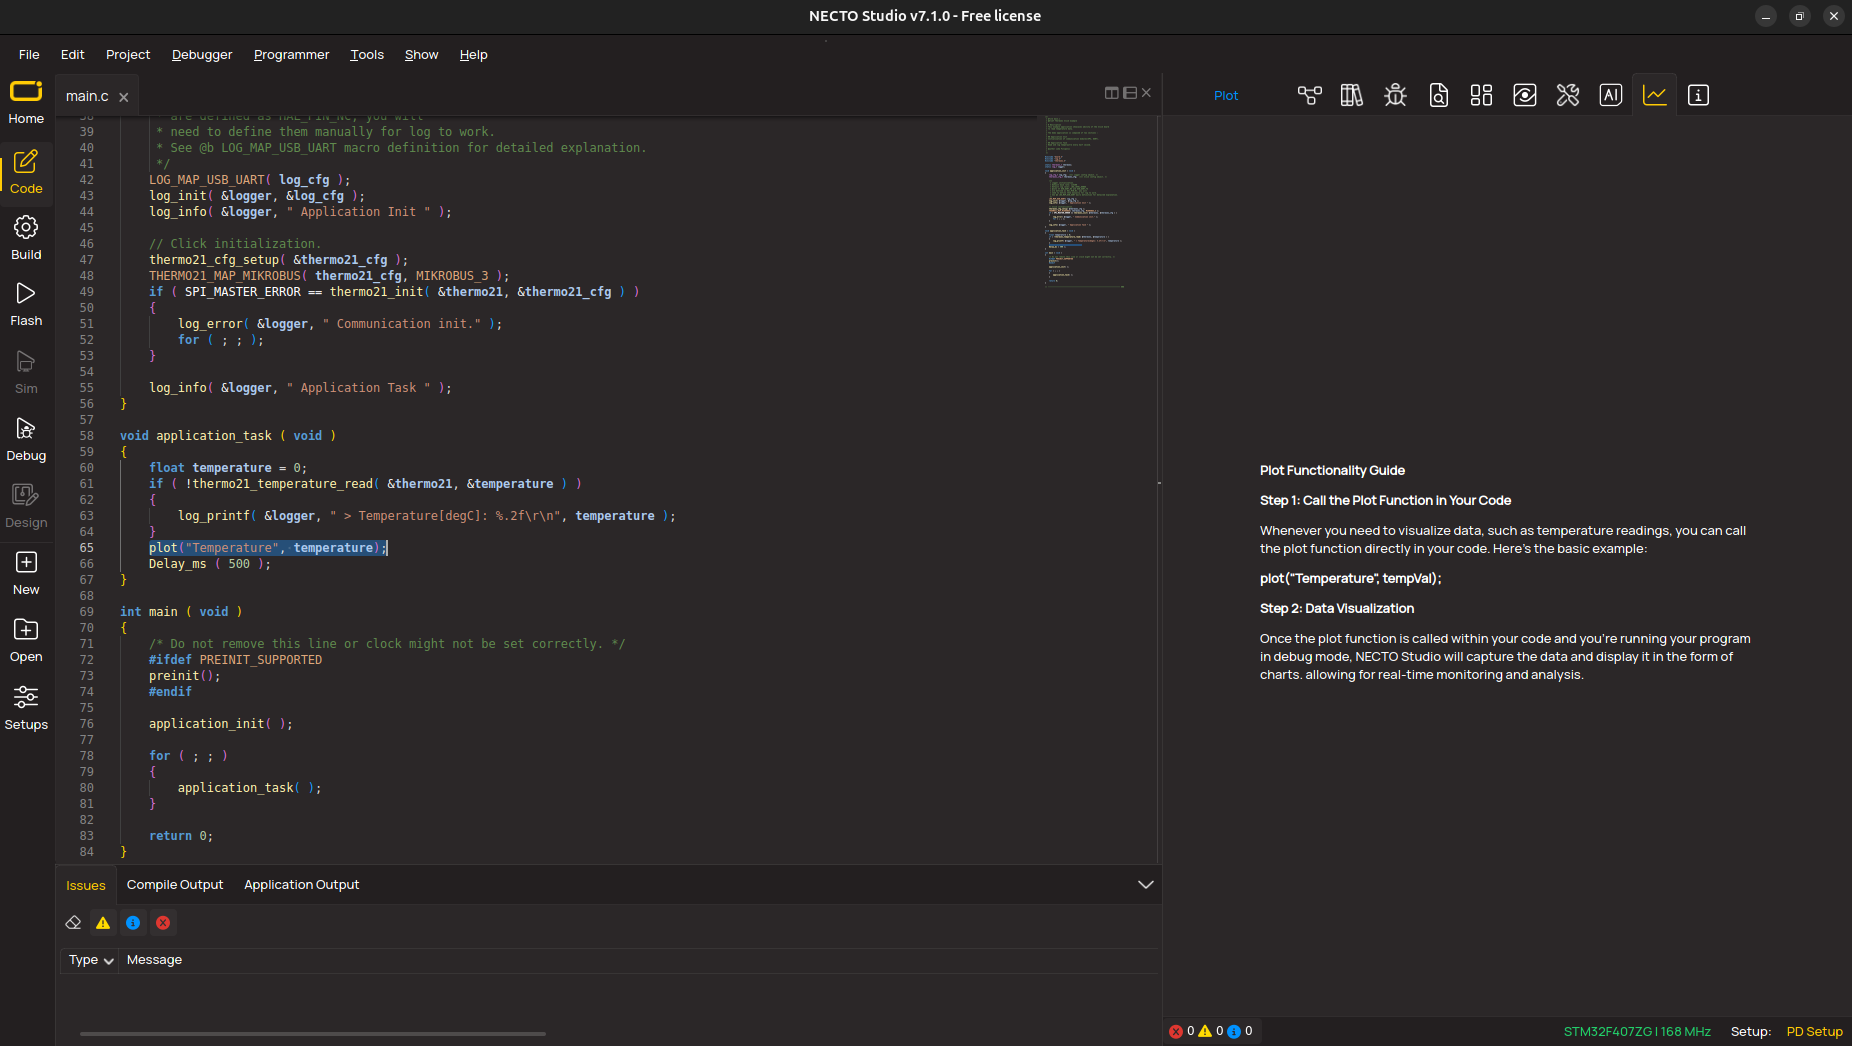
Step 5: Run the Debugger and View the Plot
- Run the
Debugfunction on the left-hand side of NECTO Studio. - Press
F6(Continue Debug) to start real-time data visualization.
Advanced Plot Features in NECTO Studio
Plotting Multiple Sensor Values
- You can use the
plotfunction multiple times to visualize data from multiple sensors. - Example:
Exploring Advanced Plot Features
Once in Continue Debug mode, you can use the following features:
- Search for Values
- Use the
search for valuesbar to filter and locate specific sensor readings. -
Press
Enterto display matching values. -
Switch View Modes
-
Toggle between Chart View and Table View.
-
Erase Table
-
Clear all recorded values with the Erase Table button.
-
Add New Charts
- Click
Add New Chartto overlay multiple data graphs. - Configure the new chart:
- Select chart type: Line, Spline, Area, Scatter, or Bar.
- Define units, name, and data sources.
- Click
Add Chartto finalize.
Customizing Charts
Once a chart is created, you can:
- Edit Chart Settings – Modify chart configurations.
- Reset Chart View – Restore default zoom and positioning.
- Detach Chart View – Move charts independently in the interface.
- Close Chart View – Remove charts when no longer needed.
📌 Additional Chart Controls:
- Left-click on a chart to drag and reposition it.
- Zoom in/out by holding
CTRLand scrolling with the mouse. - Export Chart: Right-click on a chart to save it as a
*.pngimage.
Stopping Debugging
Once you’ve completed your analysis, simply stop the debugger to exit Plot mode.
Plot Feature: Works with Both Local and Remote Hardware
It's important to note that the Plot feature is completely independent of the Planet Debug feature. The Smart Thermostat example showcased here was simply a way to demonstrate how you can use Plot right from your laptop, without needing additional hardware, making it accessible for free. However, you can just as easily use the Plot feature with your own hardware setup on your workbench. The plotting principles remain the same—whether you're visualizing data from a remotely accessed development board via Planet Debug or from a sensor directly connected to your local development system. 🚀
Final Thoughts
NECTO Studio’s Plot feature provides an intuitive way to visualize real-time sensor data, aiding debugging and analysis. By integrating the plot function, you can monitor multiple sensor readings simultaneously and utilize advanced features to tailor your visualization needs.